Archive for the ‘Mathematics’ Category
Simulating Repeated Significance Testing
My colleague Mats has an excellent piece on the topic of repeated significance testing on his blog.
To demonstrate how much [repeated significance testing] matters, I’ve ran a simulation of how much impact you should expect repeat testing errors to have on your success rate.
The simulation simply runs a series of A/A conversion experiments (e.g. there is no difference in conversion between two variants being compared) and shows how many experiments ended with a significant difference, as well as how many were ever significant somewhere along the course of the experiment. To correct for wild swings at the start of the experiment (when only a few visitors have been simulated) a cutoff point (minimum sample size) is defined before which no significance testing is performed.
Although the post includes a link to the Perl code used for the simulation, I figured that for many people downloading and tweaking a script would be too much of a hassle, so I’ve ported the simulation to a simple web-based implementation.

You can tweak the variables and run your own simulation in your browser here, or fork the code yourself on Github.
Restaurant Reviews and the Availability Heuristic
You could say fine dining is a bit of a hobby of mine; and as I’ve mentioned before, I’ve composed quite a few restaurant reviews over the years. I enjoy writing about food almost as much as I love eating it.
Whilst fantasising about fancy food with a colleague the other day, we wondered whether there is any relation between the lengthiness of my reviews and the associated score. In some strange way it made intuitive sense to me that I would devote more words to describe why a particular restaurant did not live up to my expectations.
Thinking about this, the first negative review that came to my mind was one I wrote for “The Good View” in Chiang Mai, Thailand.
If service were any slower than it already is, cobwebs would certainly overrun the place. When food and drinks eventually do arrive they’re hardly worth the wait.
Fruit juice contained more sugar than a Banglamphu brothel and cocktails had less alcohol in them than a Buddhist monk. The mixed Northern specialties appetizer revealed itself to be three kinds of sausage and some raw chillies; very special indeed.
The spicy papaya salad probably tasted alright, but I was unable to tell because my taste buds were destroyed on the first bite. (Yes, I see the irony in complaining a spicy papaya salad was too spicy, but in my mind there’s a difference between spicy food and napalm.)
Also, the view is terribly overrated.
Conversely, the first positive review that popped into my brain was this rather terse piece for “Opium” in Utrecht, the Netherlands.
Om nom nom.
Judging by this tiny sample there might indeed be something to the hypothesis that review length and review score are negatively correlated. To confirm my hunch, I decided to load my reviews into R for a proper statistical analysis.
> cor.test(nn_reviews$char_count, nn_reviews$score)

Pearson's product-moment correlation
data: nn_reviews$char_count and nn_reviews$score
t = 0.2246, df = 121, p-value = 0.8227
alternative hypothesis: true correlation is not equal to 0
95 percent confidence interval:
-0.1571892 0.1967366

sample estimates:
   cor
0.02041319
To my surprise, the analysis shows there is practically no relation between length and score. Contrary to what the two reviews above seem to suggest I do not require more letters to describe an unpleasant dining experience as opposed to a pleasant one.
A simple plot of the two variables gives some insight into a possible cause for my misconception.
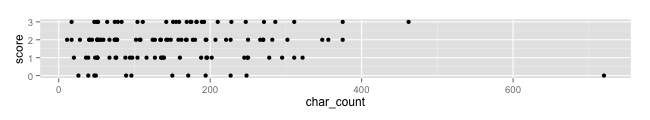
Review scores vs review length
The outlier in the bottom right happens to represent my review for the Good View. All my other reviews are much shorter in length and seem to be quite evenly distributed over the different scores.
My misjudgement is an excellent example of the availability heuristic. The pair of examples that presented themselves to me upon initial reflection were not representative of the complete set, but that did not stop me from drawing overarching, and incorrect, conclusions based on a sample of two.
This is why I use statistics, because I am a fallible human being; just like everyone else
Snake Oil and Tiger Repellant
The Wall Street Journal has an interesting article explaining how companies are starting to use (big) data to support their recruiting efforts. It provides a good example of the more general trend in businesses towards evidence-based decisioning and data science, but it also shows how some crucial aspects of these techniques are easily overlooked or oversimplified.
My big-data-science-bogus-alarm started ringing upon reading the last sentence in this short paragraph.
Applicants for the job take a 30-minute test that screens them for personality traits and puts them through scenarios they might encounter on the job. Then the program spits out a score: red for low potential, yellow for medium potential or green for high potential. Xerox accepts some yellows if it thinks it can train them, but mostly hires greens.
Sounds smart, right? Well, maybe.
If Xerox never hires any “reds” and only very few “yellows”, how will they know the program is actually working? How will they know that all that complicated math is doing something more than simply returning random colour values? An evidence-based approach should always include some form of scientific control. If it doesn’t, it might as well be snake oil.
Of course, this is probably just a simple journalistic crime of omission of a trivial implementation detail, but it reminded me of that old chestnut “the tiger repellant”. For your convenience, this blogpost has been equipped with some very strong Tiger Repellant tonic. If you do not see any tigers around you right now, you will know it is working.
See? No tigers?
Proven to work like a charm. Order yours today! Great prices! Limited availability! Now taking applications in the comments.
[ Disclaimer: Tiger Repellant is not certified for use in South-East Asia or zoological parks. Tiger Repellant inc. and its employees and subsidiaries cannot be held liable for any damage caused to your person in the event of being eaten by a tiger. ]
Bin Packing Too Many Features
 My girlfriend has been struggling with an interesting little problem lately. She was asked to determine the optimal distribution of medicine boxes and bottles over a set of adaptable cabinets; under volume as well as weight constraints. Not an easy task for a computer scientist; much less for a hospital pharmacist in training.
After describing the problem to me last night I (unhelpfully) mumbled that “this sounds like a variable sized bin packing problem to me, you can’t solve the kind of thing in Excel, you probably need an LP solver”.
Apparently I was wrong. It already seemed obvious to me that Excel suffers from a severe case of feature bloat, but this is just absurd.
Understanding
Derek Jones posits that “success does not require understanding“.
In my line of work I am constantly trying to understand what is going on (the purpose of this understanding is to control and make things better) and consider anybody who uses machine learning as being clueless, dim witted or just plain lazy; the problem with machine learning is that it gives answers without explanations (ok decision trees do provide some insights).
Problem solving versus solving problems.
As one who specializes in using machine learning, I obviously resent being called “clueless, dim witted or just plain lazy”. However, I feel a larger point should be made here. Success does most definitely require understanding, but not necessarily of how one particular instance of a solution came about.
To be successful in any machine learning effort, one needs to have intricate understanding of what the problem is and how techniques can be applied to find solutions. This is a more general form of understanding which puts more emphasis on the process of finding workable models, rather than on applying these models to individual instances of a problem. Comprehension of problem solving over understanding a particular solution.
Driving a black box.
Consider the following example. To me, the engine of my car is a black box; I have very little idea how it works. My mechanic does know how engines work in general, but he is unable to know the exact internal state of the engine in my car as I am cruising down the highway at 100 miles per hour. None of this “lack of understanding” prevents me from getting from A to B. I turn the wheel, I push the peddel and off we go.
In essence, my mechanic and I have different levels of understanding of my car. But importantly, at different levels of precision, the thing becomes a black box to each of us; in the sense that there is a point where our otherwise perfectly practical models break down and no longer are able to reflect reality. In the end, it’s black boxes all the way down.
Models are merely tools to help you navigate a vastly complex world. Very much like machine learning models, a scientific model might work in many cases, but so does Newton’s law of universal gravitation. We know for a fact that that particular model is definitely wrong; and I sincerely hope many others are just as incorrect.
There will always be limits to our understanding. The fact that we have a model that can help us predict does not necessarily mean we have correctly understood the nature of the universe. All models are wrong, but some are useful.
Reality is simply much too complicated to be captured in a manageable set of rules, but even incomplete (or incorrect) models can provide insight and help us better navigate this world. Machine learning is successful, precisely because it can help us find such models.
[ Peter Norvig has written an excellent piece on this subject in relation to language models. ]
Extrapolation
There are two types of people in this world:
- Those who can extrapolate from incomplete data.
[ Via @professorkitteh. Original source unknown. ]
Why Metrics Matter
Daring Fireball quotes some interesting research findings related to what Barry Schwartz dubbed The Paradox Of Choice.
About 60% of the people stopped when we had 24 jams on display and then at the times when we had 6 different flavors of jam out on display only 40% of the people actually stopped, so more people were clearly attracted to the larger varieties of options, but then when it came down to buying, so the second thing we looked at is in what case were people more likely to buy a jar of jam.
What we found was that of the people who stopped when there were 24 different flavors of jam out on display only 3% of them actually bought a jar of jam whereas of the people who stopped when there were 6 different flavors of jam 30% of them actually bought a jar of jam. So, if you do the math, people were actually 6 times more likely to buy a jar of jam if they had encountered 6 than if they encountered 24, so what we learned from this study was that while people were more attracted to having more options, that’s what sort of got them in the door or got them to think about jam, when it came to choosing time they were actually less likely to make a choice if they had more to choose from than if they had fewer to choose from.
A fascinating psychological effect with clear implications for display advertising, but there is a lesson here for online marketeers and analysts as well.
In this study, fewer people stopped when there was less choice, but more people actually bought something. If we were only measuring the former (i.e. attention), and not the latter (i.e. sales), we would be led to think more choice would be about 50% more effective at bringing in customers. And boy, would we be wrong!
Metrics matter; especially when you are using a system which can automatically optimize your process in order to maximize those metrics.
Don’t get yourself in a jam; remember this next time you decide to measure click acceptance instead of actual sales to drive your online marketing effort. Clickthrough rates are useful as a measure by proxy, but they can be misleading.
Predicting Pi
A few weeks ago, I showed a colleague* my little visual demo of my favorite algorithm for estimating the number Pi. His immediate response was so obvious I am almost ashamed it did not occur to me before he mentioned it.
“RTD could do that!”
Turns out, he is of course right. Although Oracle Real-Time Decisions was certainly not designed for the task, it does a pretty good job of predicting Pi, given the right inputs and some mathemagic.
To reiterate, the idea behind the original algorithm is that we throw a bunch (well actually quite a lot) of darts at a square board (uniformly distributed, of course). We then count the number of darts that land in the largest circle we can fit in this square. The ratio between the darts in the circle and the total number of darts thrown, multiplied by four happens to approximate Pi for reasons explained in an earlier post.
The key thing to understand when using RTD to implement this algorithm is that the ratio described above also represents the odds that a single dart will land in the circle. More easily put, the number of darts that land in the circle divided by the total number of darts thrown equals the chance of a dart landing in the circle. If we can predict the odds of hitting the circle we can predict Pi; and RTD is pretty good at making predictions.
The Setup.
I’ll run through the RTD setup briefly. If you’re interested in a more detailed explanation how I did this, feel free to drop me a line.
RTD can only predict the likelihoods related to choices, so we’ll need a couple of those. For this experiment, we’ll pretend we have a choice of landing the dart inside or outside the circle. We’ll then diligently record whichever of those two happened to be the case each time we throw a dart so that RTD will learn to predict how likely either outcome is.
[ You can click on the screenshots below for a closer look. ]

The "In Circle" choice
As you can see, I’ve already included the likelihood as a choice attribute to be returned to the calling application. This attribute will be populated by a model aptly named Pi.

The "Pi" model
The Pi model could hardly be simpler. It will predict the likelihood of mutually exclusive choices (hence the checkbox at the bottom of the configuration) from the choice group Choices.
Note that Pi is configured as a simple so-called Choice Model, not the more common Choice Event Model. The latter, more complex model is more frequently used in practice, because it allows RTD to predict multi-step likelihoods (customer clicked an add, then put the product in his or her shopping basket, then proceeded to checkout, then completed the payment) for positive as well as negative events (e.g. the customer actively declines the offer).
We’ll use a client application similar to the one used in the earlier Pi experiments to simulate the throwing of darts. This application will also show the predicted value of Pi. For this client to tell RTD about darts thrown and RTD to respond with the predicted value we will use a single advisor. The RTD server will generate a web service based on this configuration.

The "Get Prediction" advisor request
Each request to this advisor will tell RTD about a single dart thrown. The Dart Was In Circle boolean input parameter seems pretty self-explanatory. To process this input and feed the model we will need some simple logic.

Advisor logic
This is all that is needed to allow RTD to build a model that can predict the likelihoods for the darts landing inside or outside the circle.
[ Of course we also need so performance goal and decisions to allow the advisor request to return the two choices created, but we’re not really interested in that here. As long as the request returns the In Circle choice and its Likelihood attribute we’re happy. I’ll leave this part of the configuration as an exercise for the reader. ]
The Result.
It takes RTD a while (about a thousand darts or so) to come up with a prediction at all. But when it does, it is pretty much spot on.
The prediction RTD makes seems to be less sensitive to fluctuations resulting from the randomized input. At times, RTD’s guess was even closer to the actual number Pi than the value calculated mathematical function I’d used in previous experiments (and of course, I couldn’t resist taking a screenshot when it was).

Results
RTD not only good for 986% ROI, but also for predicting Pi.
And this cake is no lie.
[* I forget who exactly suggested this. Either Alan, Simon or Tim. ]
Scientific Advertising on Steroids
It seems that my little rant against the apparent lack of scientific rigor and the use of data to analyse performance in the world of advertising is nothing new. Scientific Advertising, written in 1923 by advertising icon Claude C. Hopkins, lays out a convincing argument in favor of the use of an empirical and results-oriented approach in all marketing.
The bottom line of this argument is the same as the true bottom line for every company. It’s all about the money.
Scientific advertising is impossible without [knowing your results]. So is safe advertising. So is maximum profit.
Groping in the dark in this field has probably cost enough money to pay the national debt. That is what has filled the advertising graveyards. That is what has discouraged thousands who could profit in this field. And the dawn of knowledge is what is bringing a new day in the advertising world.
Hopkins pioneered the use of keyed coupons to track the success of different campaigns and ads. He believed that the only purpose of advertising was to sell more products and that the effects of such efforts should be measurable and those responsible be held accountable. New ideas and concepts should be tried in a small, controlled and safe setting so that their (monetary) results could be measured and analyzed.
Only when a new approach proved to be successful in a number of trails could it be trusted to be applied at larger scale. Take this passage from his autobiography My Life in Advertising.
How have I been able to win from this situation so many great successes? Simply because I made so many mistakes in a small way, and learned something from each. I made no mistake twice. Every once in a while I developed some great advertising principle. That endured.
The technology of the time allowed Hopkins et al. to try new things and make mistakes only on a per town basis. Results had to be analyzed manually and each iteration required significant effort and some investment. Still, what knowledge could be gleaned from these relatively small scale ventures proved key to Hopkins’ success in advertising.
Judging by his own accounts it never occurred to Hopkins that different ads would have different results for different towns or different people. He was simply empirically searching for the perfect ad; one town at a time. Once found, this super ad would be unleashed upon the entire nation.
In that light, Oracle Real-Time Decisions (RTD) is like the traditional scientific advertising method on steroids. Not only does it apply the concepts of empirically testing success and failing in small doses and learns from those mistakes automatically; it is also able to segment the respondents into an seemingly infinite number of sub-groups and find a super ad for each.
Computing Science has taken Scientific Advertising to the next level; and you cannot afford not to follow.
[As a side note, I think it important to realize that Scientific Advertising was written before Edward Bernays took his uncle‘s ideas and used them to revolutionize the field of advertising. Thanks to Hopkins’s scientific and empirical approach most of the facts and results cited still hold water, but some of the explanations and conclusions he puts forward are terribly outdated. If you want to know more, I can highly recommend Adam Curtis‘s award-winning 2002 documentary for the BBC, The Century of Self.]
Solving Some Sudoku Puzzles Faster (I Stand Corrected)
Okay. So maybe I was jumping to conclusions a little early in the game.
After I posted my own modified version of Peter Norvig‘s Sudoku Solver, Peter and I had some brief discussion about my results and conclusions. I had only compared the performance of the two algorithms based on the ninety-five difficult puzzles provided by Peter, but he was not convinced. So I set out to make a more rigorous analysis of the relative strengths of our approaches using the method for generating random puzzles included in the original code. The results were a little unexpected, but not very surprising.
Fair game.
To make this a fair competition, I made some slight modifications.
Firstly, I had to ensure that both algorithms were solving the exact same random puzzles. Otherwise one algorithm might, simply by virtue of some serious bad luck, end up with more difficult puzzles. This is especially important since Peter’s experiments showed that long execution times (difficult puzzles) are rare but have an extreme impact; a few puzzles taking more than a minute to solve.
Secondly, I modified the code so that it uses the timeit module for measuring execution times. This allowed me to measure execution times more precisely.
More pudding.
Overnight, one million random puzzles were attempted by the two competing algorithms (999.925 were actually solved). Peter’s original algorithm required an average of 0.007 seconds per puzzle (142 puzzles per second) with a maximum execution time of 91.06 seconds. For the same puzzles, my modified version required an average of 0.008 seconds per puzzle (124 puzzles per second) with a maximum execution time of merely 5.75 seconds.
Both these averages are far lower than those for the ninety-five difficult puzzles attempted earlier, but the maxima are orders of magnitude higher. This seems to indicate that most of these random puzzles are easier to solve; save for a few extreme puzzles. This is in line with Peter’s earlier findings.
Sudoku algorith execution times
The original algorithm solves these random puzzles about fourteen percent quicker on average, but the distribution of execution times is more spread out; as is evident from the much larger standard deviation and higher maximum.
Mea culpa. But not for maxima.
Based on these findings I have to admit I was wrong. My modified algorithm does not solve every Sudoku puzzle faster, as the title of my previous post implied. When solving many, randomly generated puzzles the original is slightly faster on average.
But when the task at hand involves more difficult Sudoku puzzles, or when you are operating under strict time constraints (i.e. you want more certainty about the maximum time required to solve a single puzzle), my money is still on the modified version. The exact puzzle that required the original algorithm 91.06 seconds to solve took the modified version a mere 0.0079870224 seconds. I’d say that is an improvement.
There’s a tool for every job.
When we were discussing how Peter had generated the graphs he used in his article, I remarked (tongue-in-cheek) that copying and pasting execution times into a spreadsheet sounded a lot like brute-force manual labour to me. I think his response summarizes this whole exercise for me quite well.
Yes, but sometimes a little brute force is easier than figuring out how to do an elegant solution.
It seems to me now that sometimes a little brute force is not only easier, but that it can be faster than a more elegant solution as well. Many thanks to Peter for posing questions and pushing me to dig a little deeper.
Sir, I stand corrected!
