Author Archive
Predictive Analytics World London
In October I’ll speak at Predictive Analytics World in London. Once again, I’ll be talking about Data Science.

You can register for the event on the site. Slides are already available online.
Simulating Repeated Significance Testing
My colleague Mats has an excellent piece on the topic of repeated significance testing on his blog.
To demonstrate how much [repeated significance testing] matters, I’ve ran a simulation of how much impact you should expect repeat testing errors to have on your success rate.
The simulation simply runs a series of A/A conversion experiments (e.g. there is no difference in conversion between two variants being compared) and shows how many experiments ended with a significant difference, as well as how many were ever significant somewhere along the course of the experiment. To correct for wild swings at the start of the experiment (when only a few visitors have been simulated) a cutoff point (minimum sample size) is defined before which no significance testing is performed.
Although the post includes a link to the Perl code used for the simulation, I figured that for many people downloading and tweaking a script would be too much of a hassle, so I’ve ported the simulation to a simple web-based implementation.

You can tweak the variables and run your own simulation in your browser here, or fork the code yourself on Github.
Restaurant Reviews and the Availability Heuristic
You could say fine dining is a bit of a hobby of mine; and as I’ve mentioned before, I’ve composed quite a few restaurant reviews over the years. I enjoy writing about food almost as much as I love eating it.
Whilst fantasising about fancy food with a colleague the other day, we wondered whether there is any relation between the lengthiness of my reviews and the associated score. In some strange way it made intuitive sense to me that I would devote more words to describe why a particular restaurant did not live up to my expectations.
Thinking about this, the first negative review that came to my mind was one I wrote for “The Good View” in Chiang Mai, Thailand.
If service were any slower than it already is, cobwebs would certainly overrun the place. When food and drinks eventually do arrive they’re hardly worth the wait.
Fruit juice contained more sugar than a Banglamphu brothel and cocktails had less alcohol in them than a Buddhist monk. The mixed Northern specialties appetizer revealed itself to be three kinds of sausage and some raw chillies; very special indeed.
The spicy papaya salad probably tasted alright, but I was unable to tell because my taste buds were destroyed on the first bite. (Yes, I see the irony in complaining a spicy papaya salad was too spicy, but in my mind there’s a difference between spicy food and napalm.)
Also, the view is terribly overrated.
Conversely, the first positive review that popped into my brain was this rather terse piece for “Opium” in Utrecht, the Netherlands.
Om nom nom.
Judging by this tiny sample there might indeed be something to the hypothesis that review length and review score are negatively correlated. To confirm my hunch, I decided to load my reviews into R for a proper statistical analysis.
> cor.test(nn_reviews$char_count, nn_reviews$score)

Pearson's product-moment correlation
data: nn_reviews$char_count and nn_reviews$score
t = 0.2246, df = 121, p-value = 0.8227
alternative hypothesis: true correlation is not equal to 0
95 percent confidence interval:
-0.1571892 0.1967366

sample estimates:
   cor
0.02041319
To my surprise, the analysis shows there is practically no relation between length and score. Contrary to what the two reviews above seem to suggest I do not require more letters to describe an unpleasant dining experience as opposed to a pleasant one.
A simple plot of the two variables gives some insight into a possible cause for my misconception.
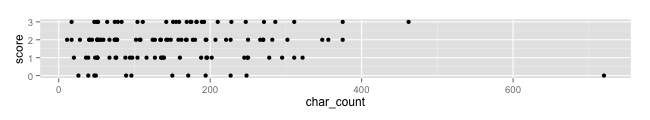
Review scores vs review length
The outlier in the bottom right happens to represent my review for the Good View. All my other reviews are much shorter in length and seem to be quite evenly distributed over the different scores.
My misjudgement is an excellent example of the availability heuristic. The pair of examples that presented themselves to me upon initial reflection were not representative of the complete set, but that did not stop me from drawing overarching, and incorrect, conclusions based on a sample of two.
This is why I use statistics, because I am a fallible human being; just like everyone else
A/B Testing XXL
[I’ve tweeted about this before.]
If fashion stores believed in A/B testing, they would probably only sell white XXL shirts. Most customers would fit tent-sized garments; most colours go well with white. Giant colourless shirts would presumably have the better sales conversion rate by far.
But of course this would be far from optimal.
Customers come in different shapes and sizes. If you really want to maximise conversion, you will have to tailor to their specific needs and personal preferences. A/B testing might be the latest fashion, but the truth is that some customers will have a taste for B even though the majority might fancy A. This is why these 20 lines of code will beat A/B testing every time.
The trick is not to figure out whether A is better than B, but when A is better than B; and for whom.
Marketing should not be one-size-fits-all.
Actionable Predictive Analytics with Oracle Data Mining
Oracle Data Mining (ODM) provides powerful data mining functionality as native SQL functions within the Oracle Database. This Oracle By Example Tutorial gives a good overview of the GUI.
While being able to build predictive models on mountains of data without moving it out of the database is pretty cool in itself, I feel analysis without action is pretty much pointless. Tom Davenport describes this common data mining conundrum in Competing on Analytics.
Many firms are able to segment their customers and determine which ones are most profitable or which are most likely to defect. However, they are reluctant to treat different customers differently—out of tradition or egalitarianism or whatever. With such compunctions, they will have a very difficult time becoming successful analytical competitors—yet it is surprising how often companies initiate analyses without ever acting on them. The “action” stage of any analytical effort is, of course, the only one that ultimately counts.
The OBE tutorial describes a scenario in which a business wants to identify customers who are most likely to purchase insurance. Through a set of simple steps, a (decision tree) classification model is built that can be used to predict whether a particular customer is likely to purchase based on historic data.
In a classical data mining approach, the predictions of this model would be written to some OUTPUT_TABLE where they would be available for subsequent processing. Growing staler every minute—and soon forgotten when its newer sibling OUTPUT_TABLE_NEW_FINAL_2 is inevitably created—our precious business intelligence slowly withers away in a disregarded section of the database until ultimately dropped by a careless DBA.
Output tables are where analytical insight goes to die.
If all we were interested in was building models, we’d be better off glueing choo-choos. It is the new ways in which we can utilise these database resident models that makes this technology really interesting. With a few simple additional steps, this same model can be used in real-time to provide inline predictions based on up-to-date customer data; as well as for new customers.
All we need is a view and a join.
Update (October 3rd, 2012): as Marcos points out in the comments, I was making things far too complicated. No need for a separate join; simply select the output columns you need and pass everything directly to the view.

The join operations glues the original data and the prediction models together; The view allows us to look at the harmonised results directly. When a customer record is selected from the view the source data for this record is passed to the model to generate the predicted values in real-time. When source data changes so does the prediction. When new source records are added they are automatically processed in the same way.
-- Create a new customer.
INSERT INTO INSUR_CUST_LTV_SAMPLE (CUSTOMER_ID, LAST, FIRST) VALUES ('CU123', 'VERMEER', 'LUKAS');
1 rows inserted.
Elapsed: 00:00:00.003

-- Get prediction and probability for the new customer.
SELECT CUSTOMER_ID, insur_pred, insur_prob FROM insur_cust_ltv_prediction WHERE CUSTOMER_ID = 'CU123';
CUSTOMER_ID INSUR_PRED INSUR_PROB
----------- ---------- ----------
CU123       No         0.7262813
Elapsed: 00:00:00.004

-- Update customer data.
UPDATE INSUR_CUST_LTV_SAMPLE SET bank_funds = 500, checking_amount = 100 WHERE CUSTOMER_ID = 'CU123';
1 rows updated.
Elapsed: 00:00:00.003

-- Get prediction and probability for the updated customer.
SELECT CUSTOMER_ID, insur_pred, insur_prob FROM insur_cust_ltv_prediction WHERE CUSTOMER_ID = 'CU123';
CUSTOMER_ID INSUR_PRED INSUR_PROB
----------- ---------- ----------
CU123       Yes        0.6261398
Elapsed: 00:00:00.004
Seamless. Any system that can read data from an Oracle database can now utilise Oracle Data Mining models. No need to move your data. No need to build new applications.
Applications reading data from the view need never know the difference between the original source data and machine generated predictions. Oracle Business Intelligence Publisher can easily display this data in forecasting reports; or use it to power pro-active alerts. In Oracle Real-Time Decisions, rules can be built around the outcomes of these models; or predictions from multiple sources can be fed into combined likelihood models for increased accuracy.
This is huge. Trust me. Stop over-analysing and start taking action. After all, that’s the only step that ultimately counts.
Snake Oil and Tiger Repellant
The Wall Street Journal has an interesting article explaining how companies are starting to use (big) data to support their recruiting efforts. It provides a good example of the more general trend in businesses towards evidence-based decisioning and data science, but it also shows how some crucial aspects of these techniques are easily overlooked or oversimplified.
My big-data-science-bogus-alarm started ringing upon reading the last sentence in this short paragraph.
Applicants for the job take a 30-minute test that screens them for personality traits and puts them through scenarios they might encounter on the job. Then the program spits out a score: red for low potential, yellow for medium potential or green for high potential. Xerox accepts some yellows if it thinks it can train them, but mostly hires greens.
Sounds smart, right? Well, maybe.
If Xerox never hires any “reds” and only very few “yellows”, how will they know the program is actually working? How will they know that all that complicated math is doing something more than simply returning random colour values? An evidence-based approach should always include some form of scientific control. If it doesn’t, it might as well be snake oil.
Of course, this is probably just a simple journalistic crime of omission of a trivial implementation detail, but it reminded me of that old chestnut “the tiger repellant”. For your convenience, this blogpost has been equipped with some very strong Tiger Repellant tonic. If you do not see any tigers around you right now, you will know it is working.
See? No tigers?
Proven to work like a charm. Order yours today! Great prices! Limited availability! Now taking applications in the comments.
[ Disclaimer: Tiger Repellant is not certified for use in South-East Asia or zoological parks. Tiger Repellant inc. and its employees and subsidiaries cannot be held liable for any damage caused to your person in the event of being eaten by a tiger. ]
Bin Packing Too Many Features
 My girlfriend has been struggling with an interesting little problem lately. She was asked to determine the optimal distribution of medicine boxes and bottles over a set of adaptable cabinets; under volume as well as weight constraints. Not an easy task for a computer scientist; much less for a hospital pharmacist in training.
After describing the problem to me last night I (unhelpfully) mumbled that “this sounds like a variable sized bin packing problem to me, you can’t solve the kind of thing in Excel, you probably need an LP solver”.
Apparently I was wrong. It already seemed obvious to me that Excel suffers from a severe case of feature bloat, but this is just absurd.
